stage
iXMaps Stage
Interactive map examples built with iXMaps. Live at https://gjrichter.github.io/stage/
Root
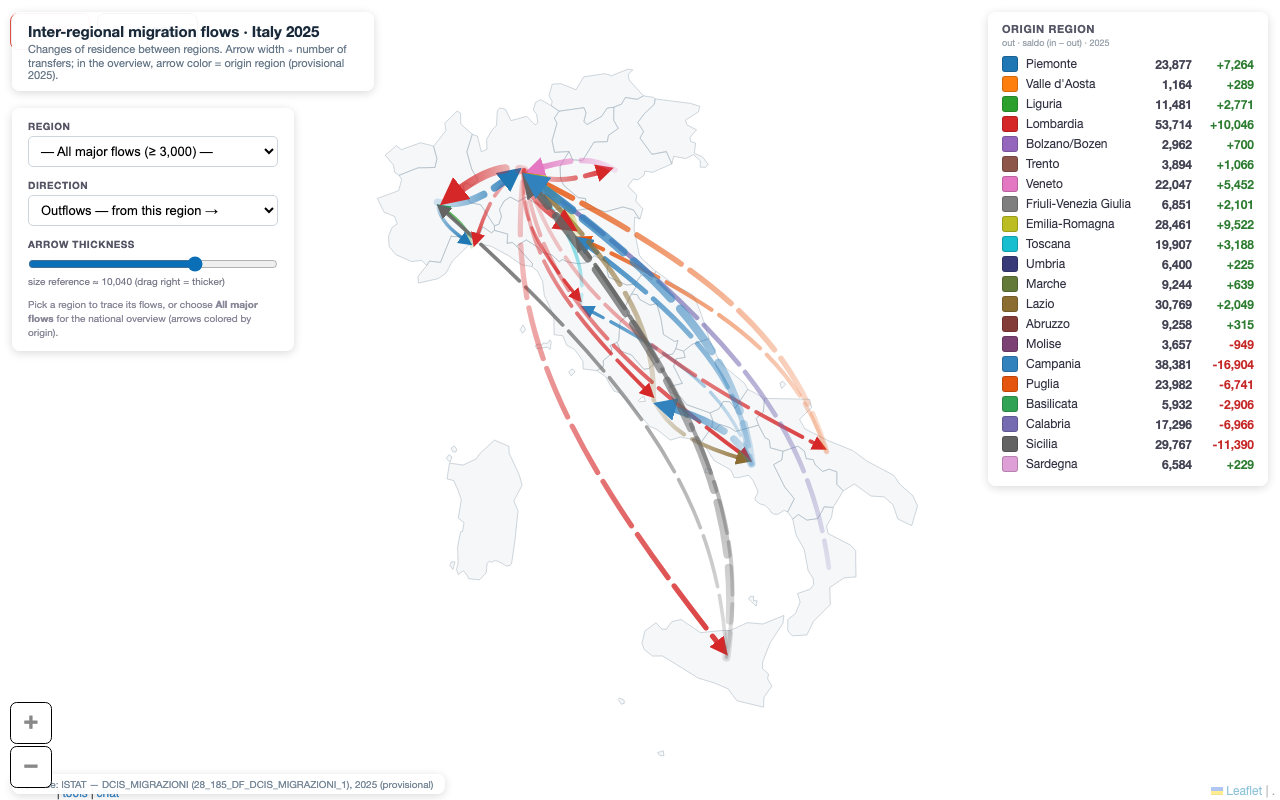 Italian internal migration flows Region-to-region migration rendered as flow lines & proportional bubbles, 2025. OPEN → · see code → |
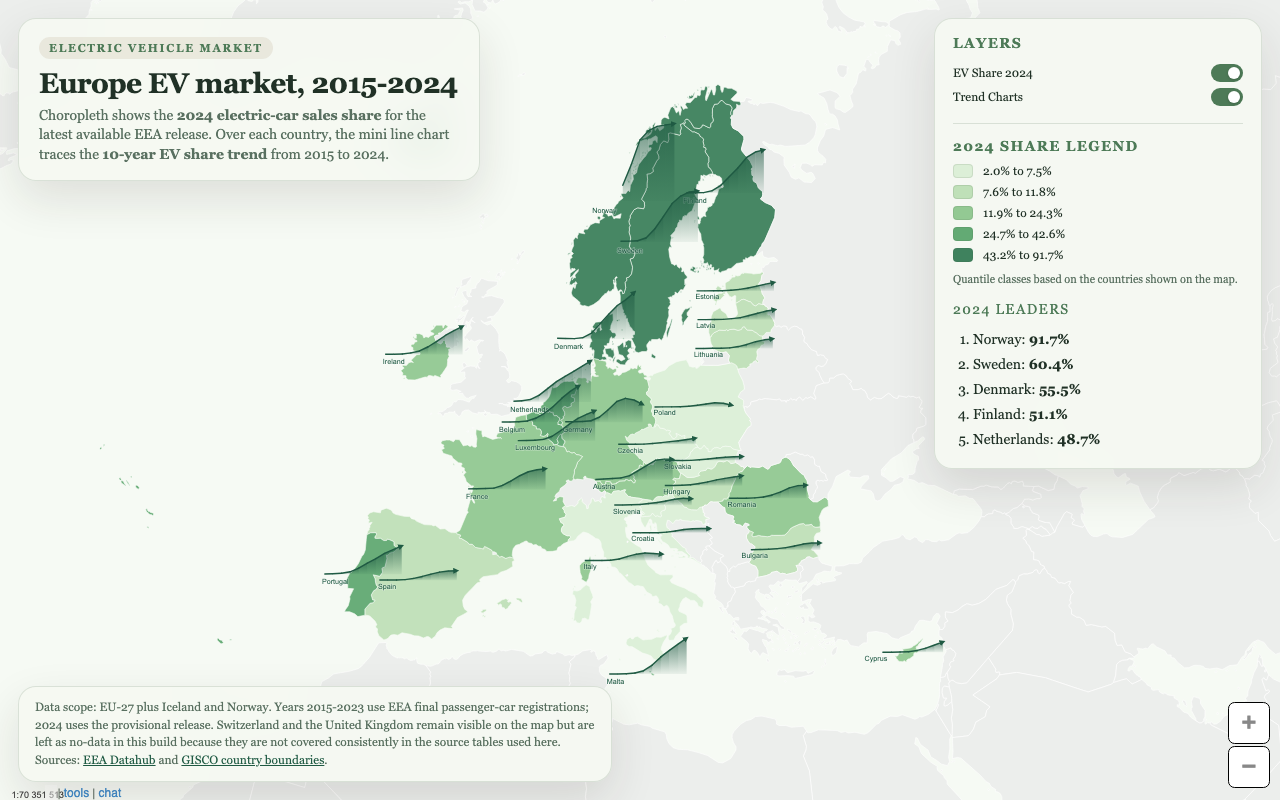 Europe EV market 2015–2024 Electric-vehicle adoption across European NUTS regions, animated over time. OPEN → · see code → |
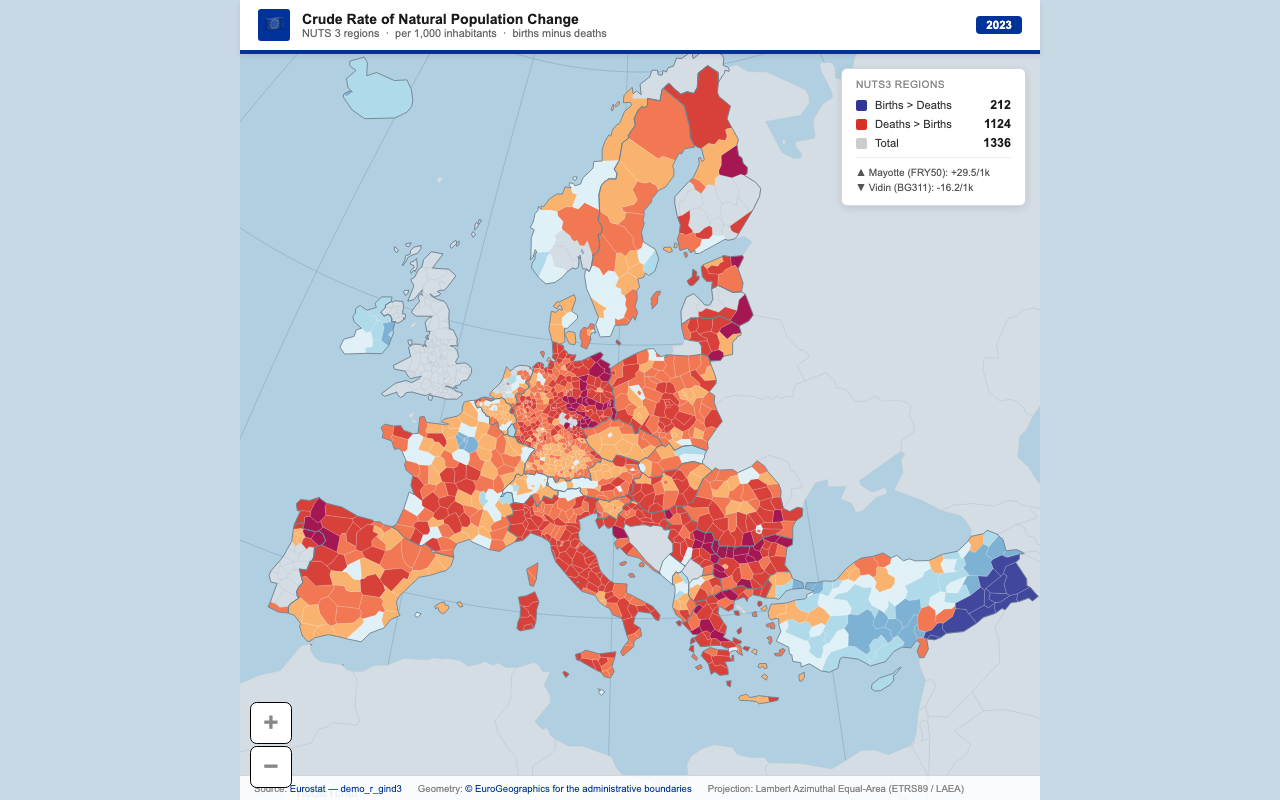 EU natural population balance Births minus deaths across NUTS3 regions, Eurostat style. OPEN → · see code → |
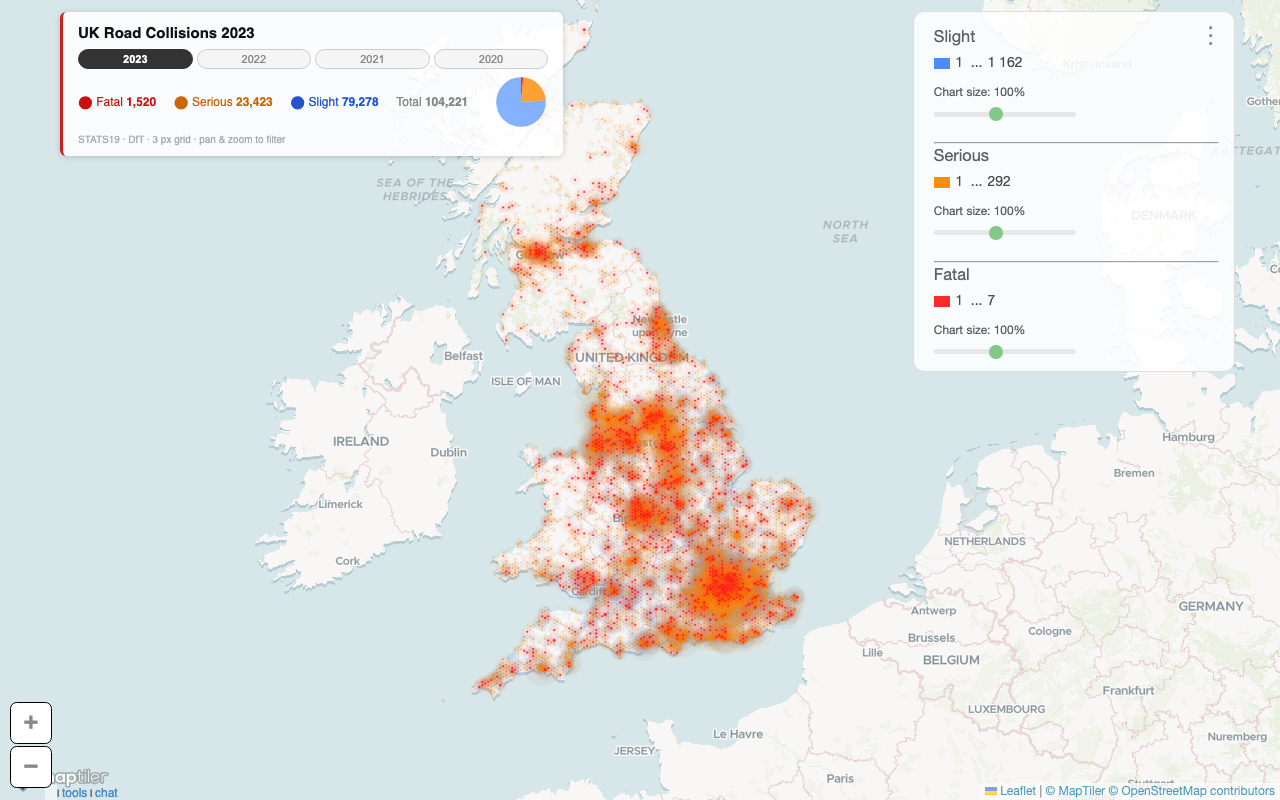 UK road collisions 2023 All recorded UK road collisions 2023, coloured by severity. OPEN → · see code → |
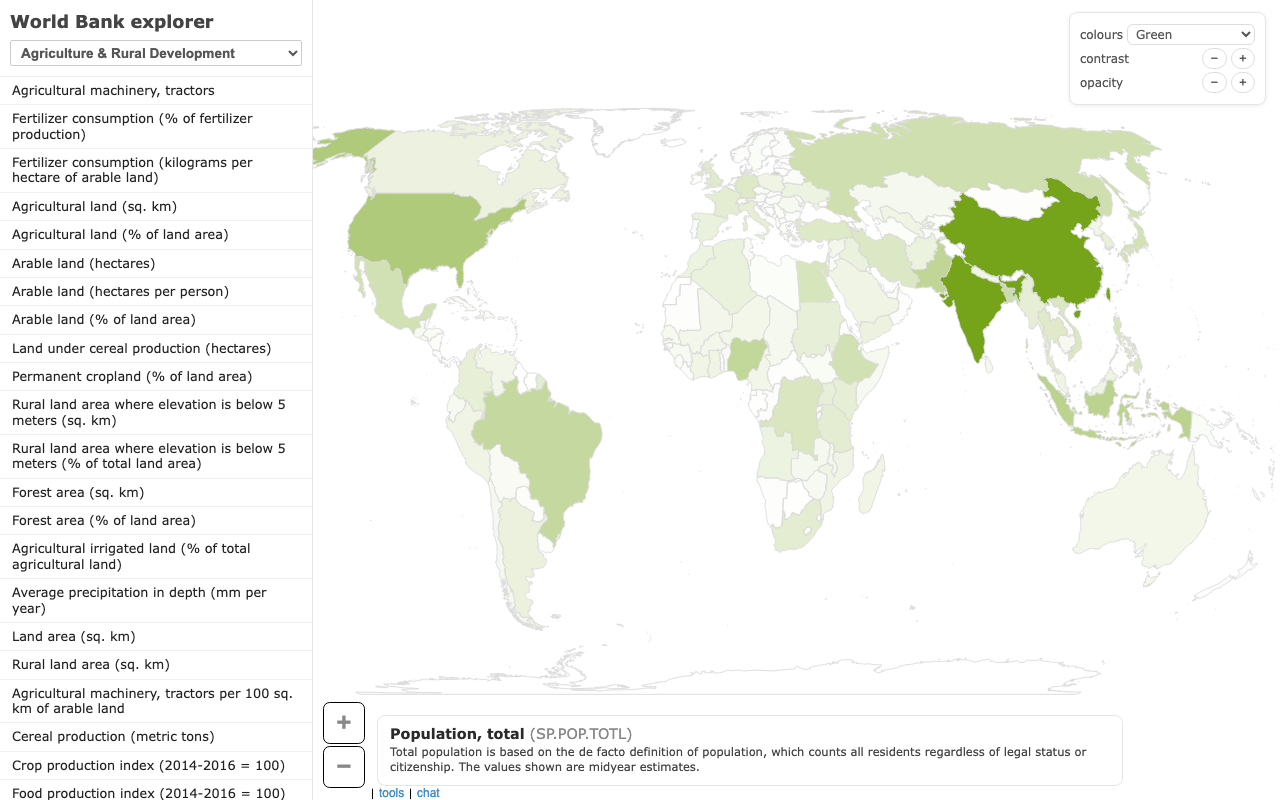 World Bank data explorer Browse World Bank indicators on a world choropleth with live data. OPEN → · see code → |
 Interactive legend Choropleth with a clickable legend to filter and highlight categories. OPEN → · see code → |
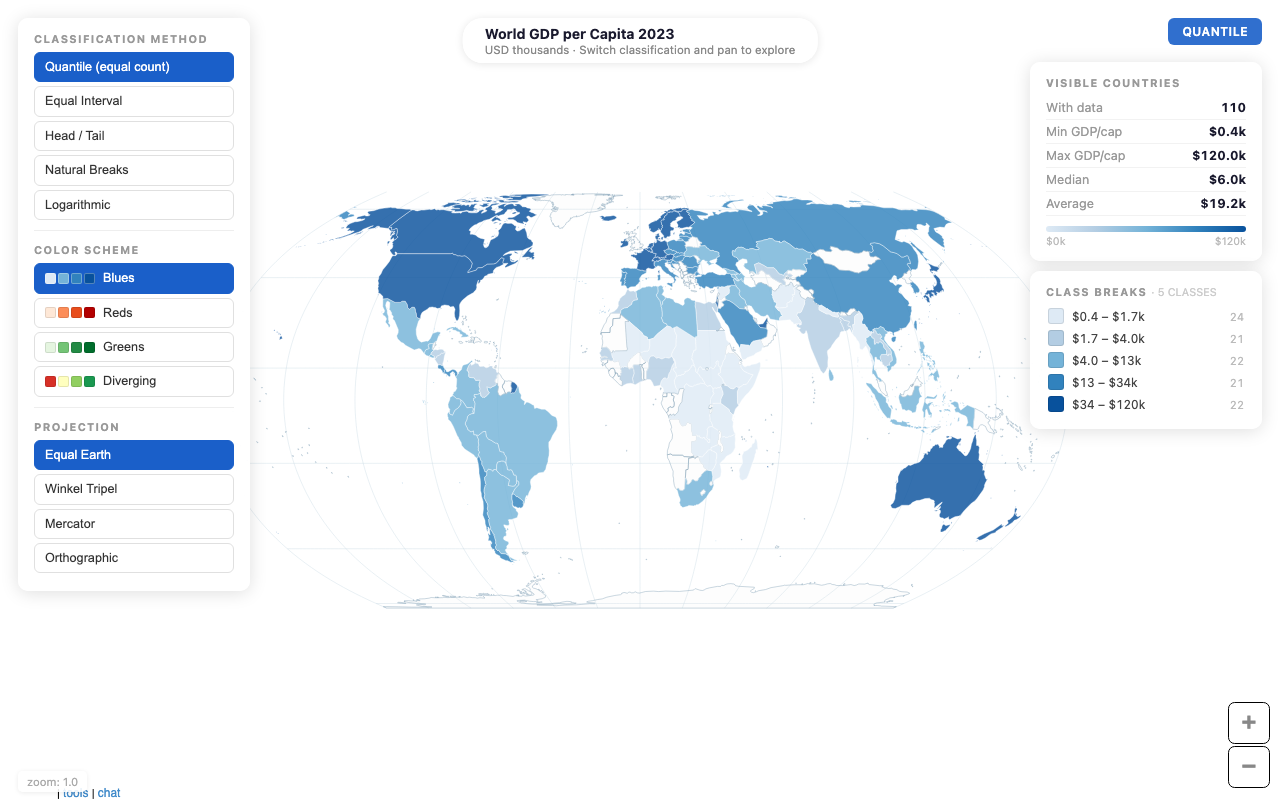
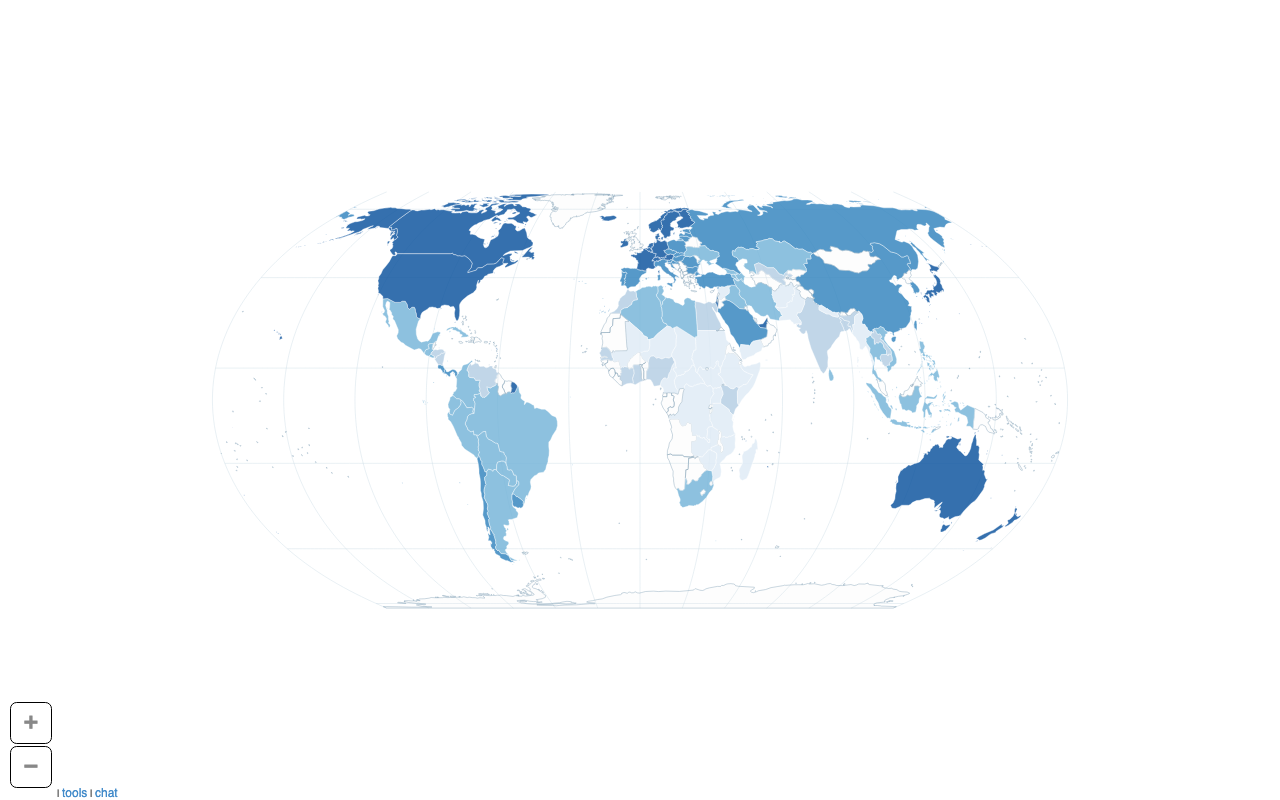 GDP minimal map Minimal choropleth showing GDP per capita at country level. OPEN → · see code → |
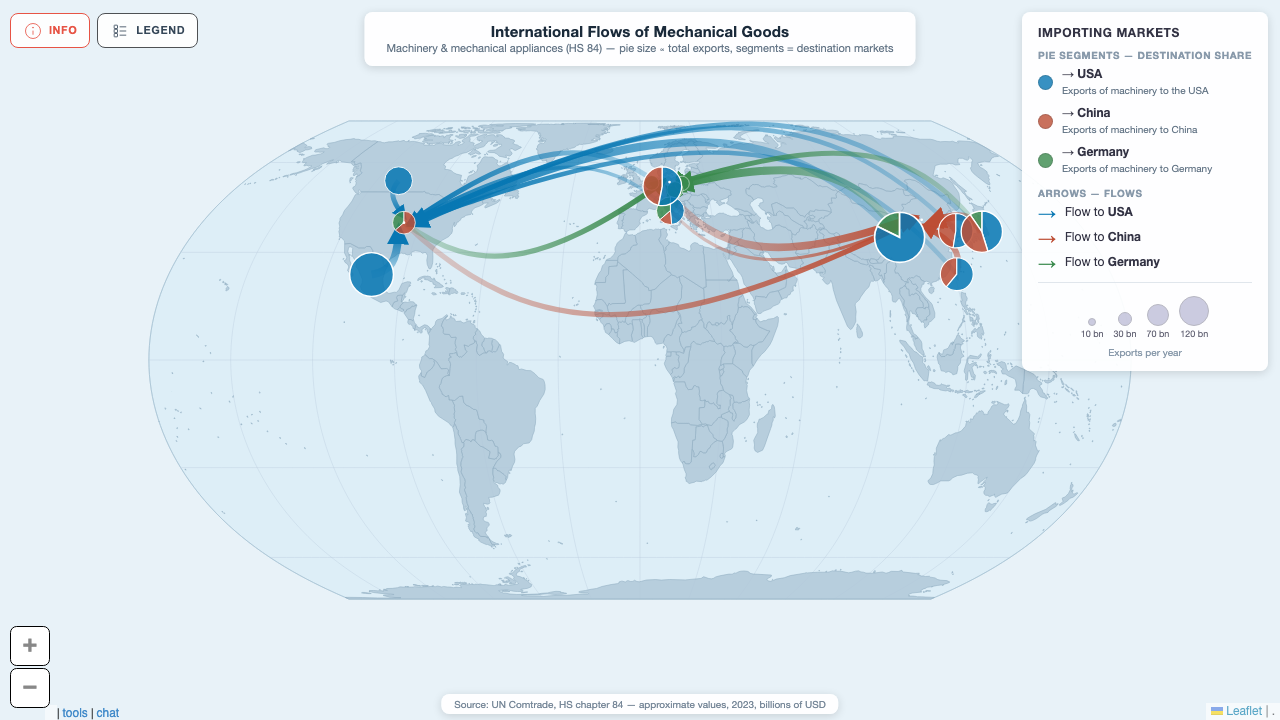 International flows of mechanical goods HS84 bilateral export flows to USA, China & Germany — proportional bubbles & flow arrows on a world map. OPEN → · see code → |
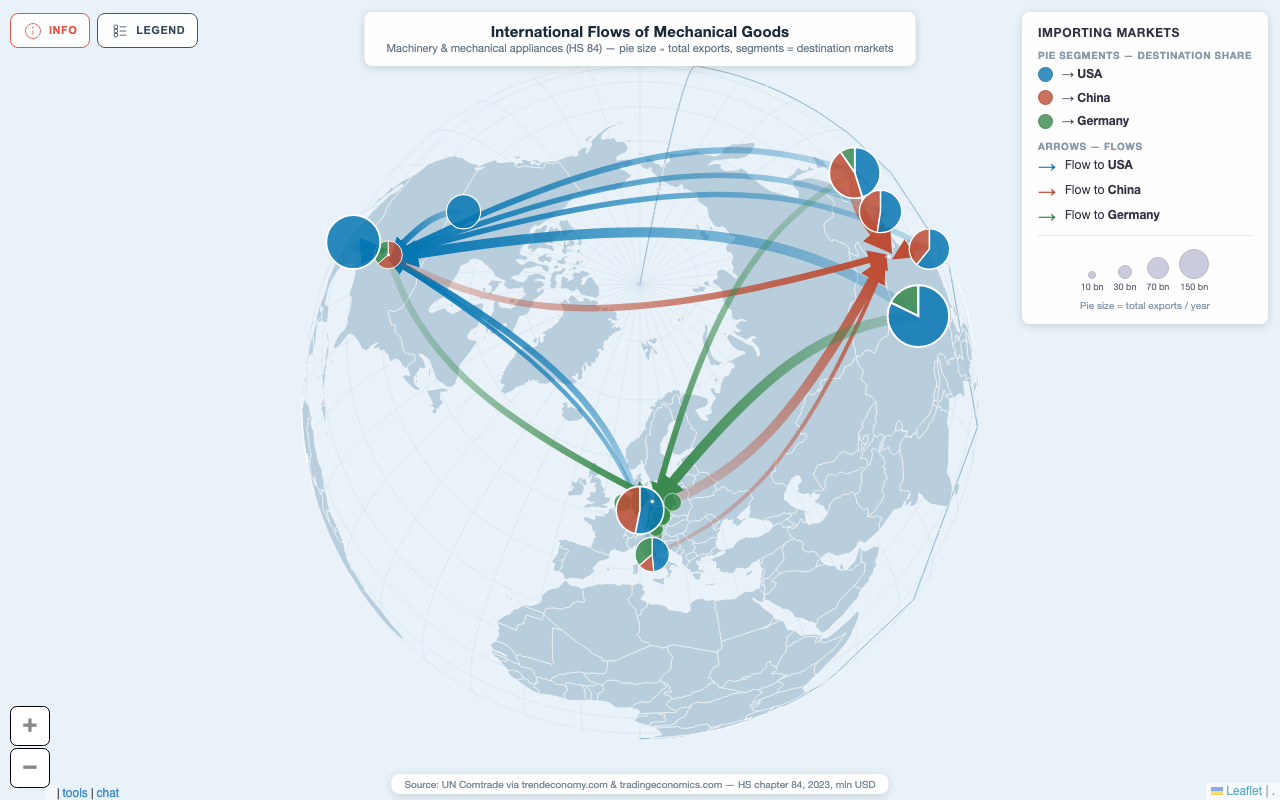 Mechanical goods flows — globe Same HS84 trade flows on a globe projection with pie charts per exporting country. OPEN → · see code → |
accidents/
Road accident maps for Italian and French cities.
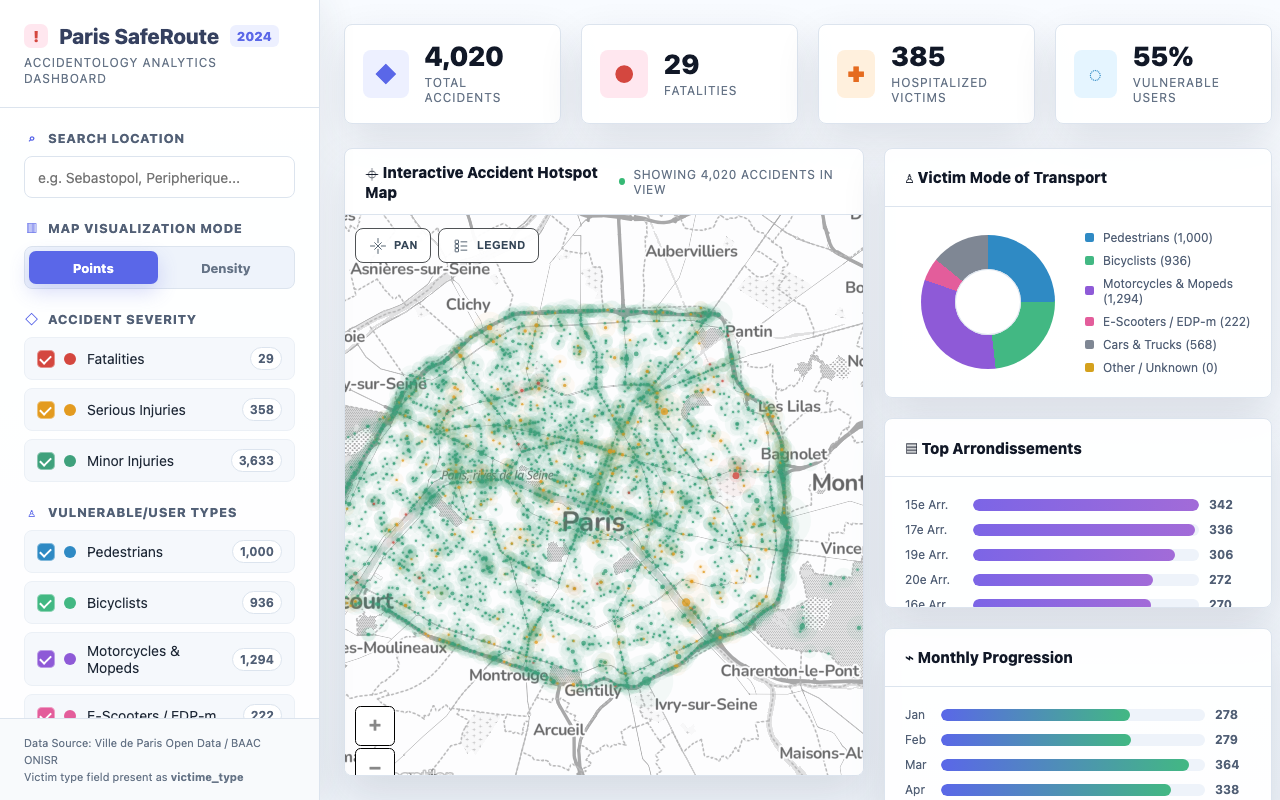 Paris SafeRoute 2024 Paris accident hotspot map with sidebar stats by type and location. OPEN → · see code → |
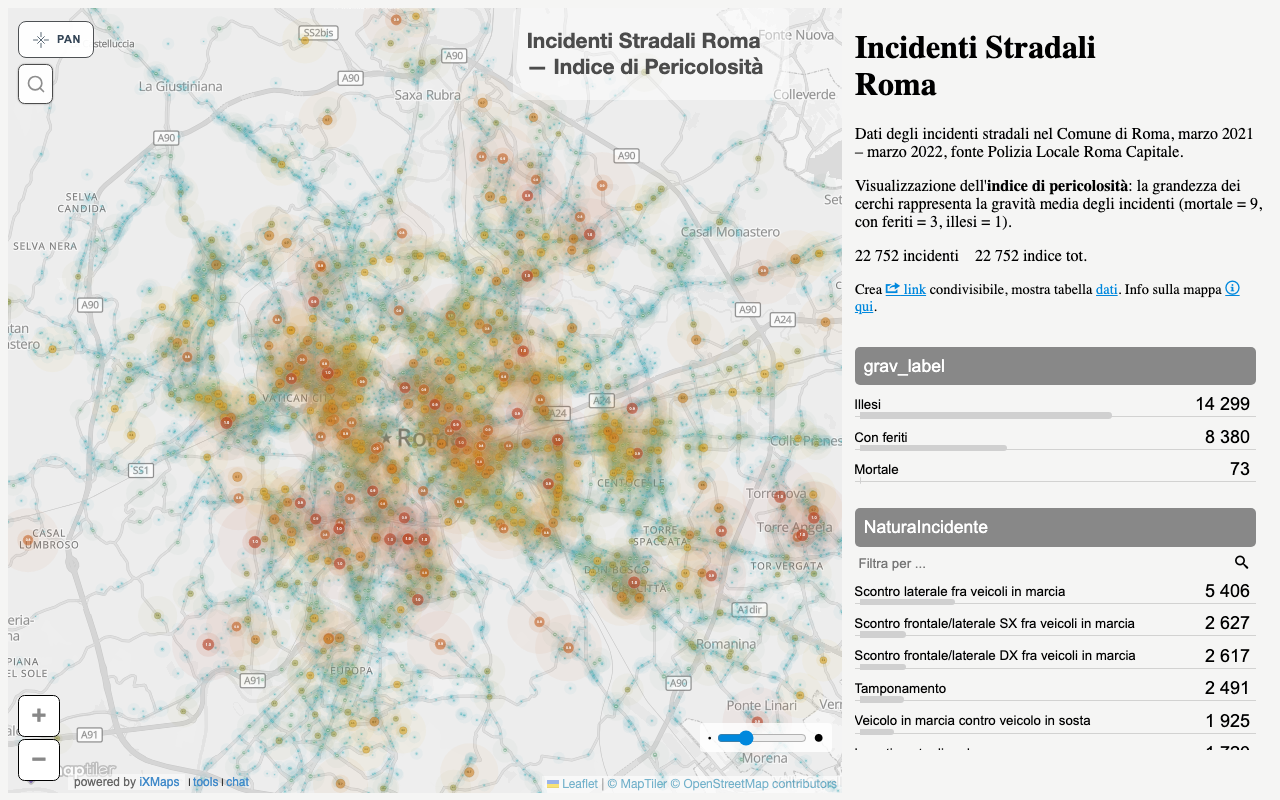 Roma incidenti — pericolosità Rome road danger index with sidebar explorer, 2021–2022. OPEN → · see code → |
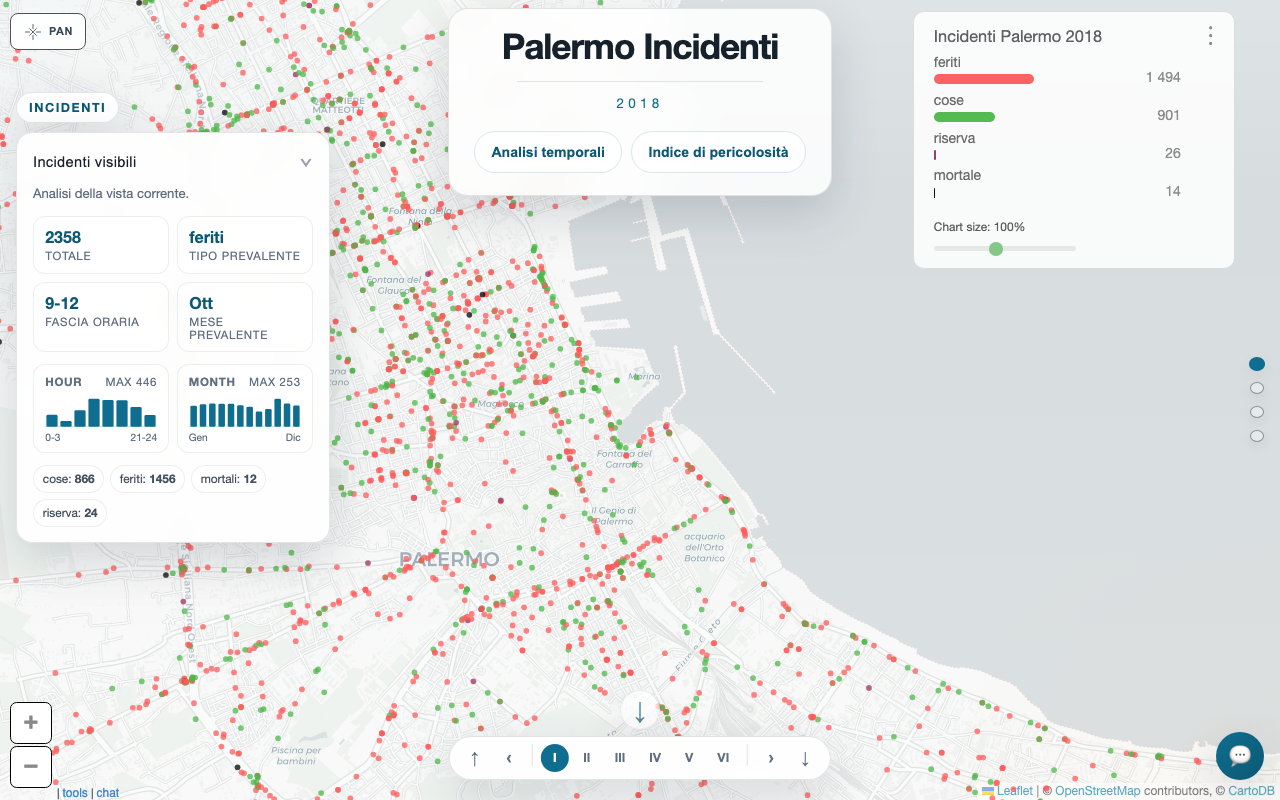 Palermo incidenti 2018 Palermo accident map 2018, remade with the flat framework. OPEN → · see code → |
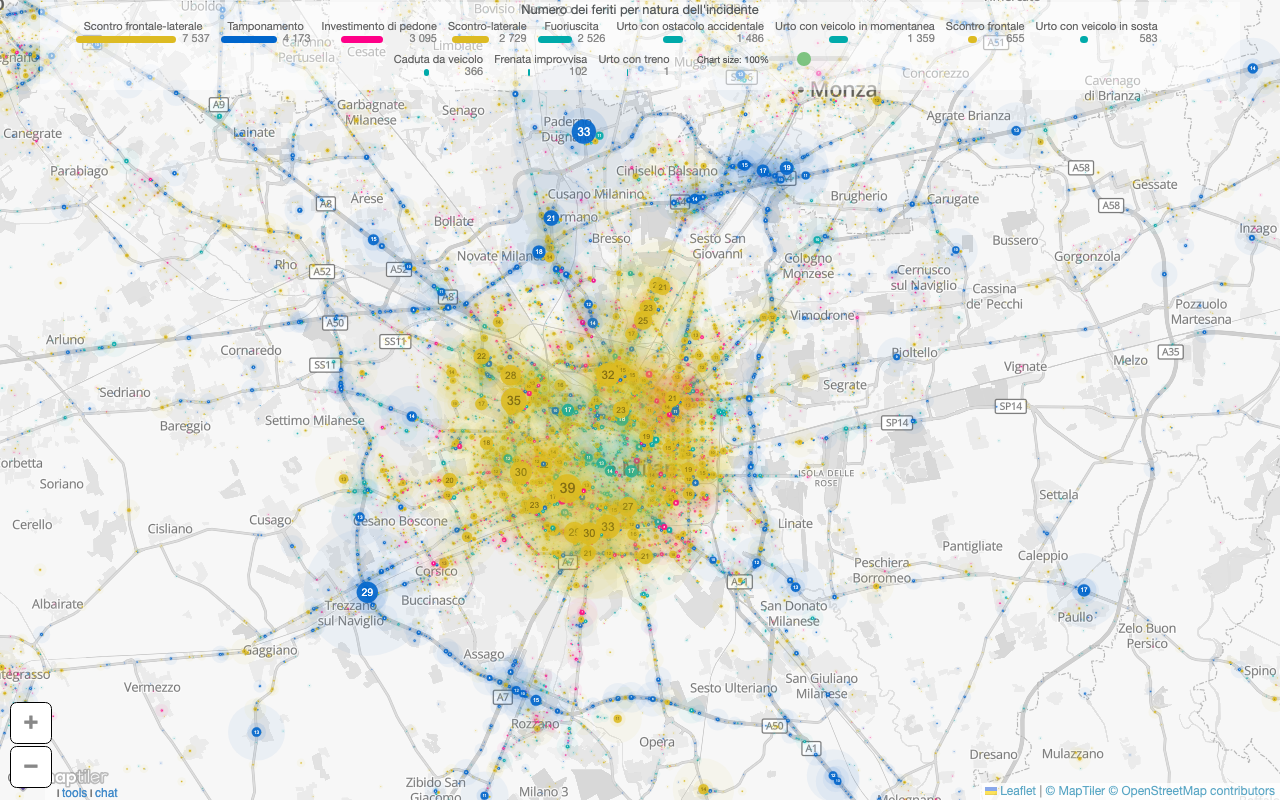
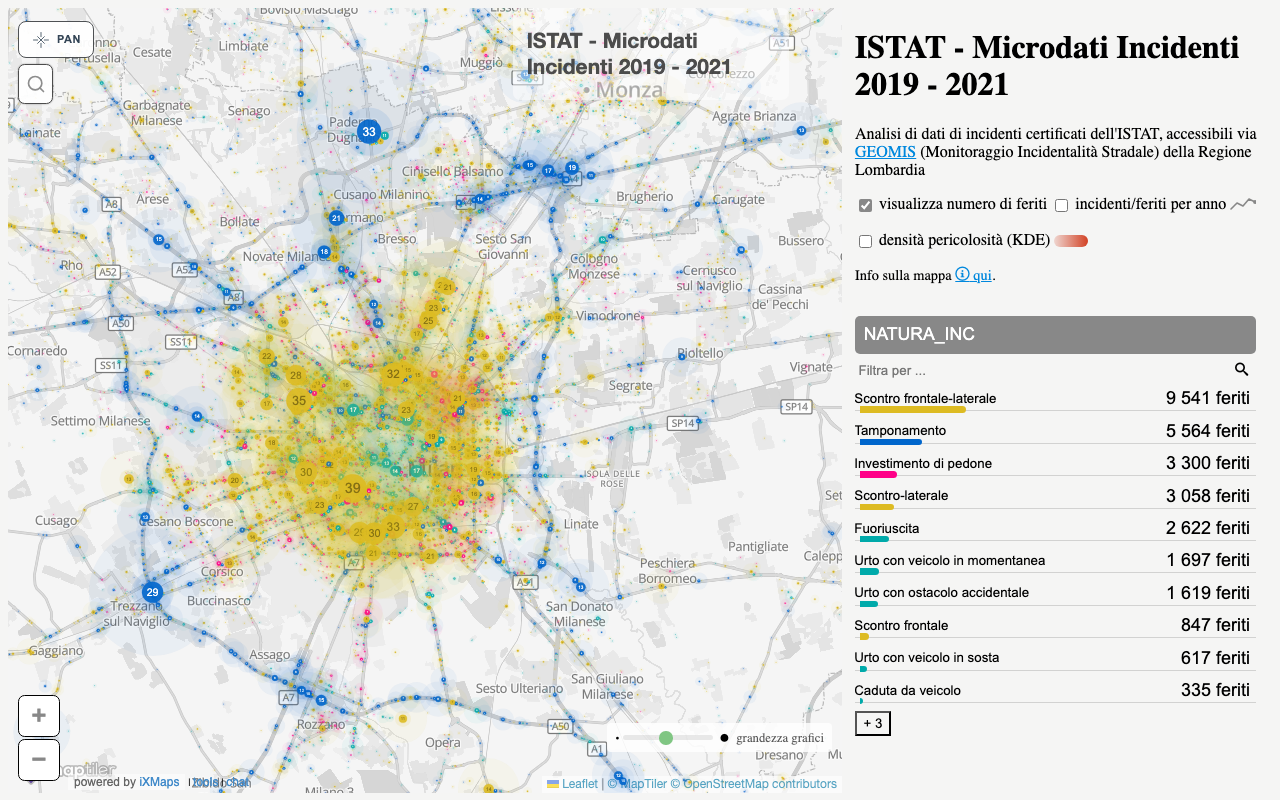 ISTAT incidenti 2019–2022 (KDE) Italian road accidents by type, vector tile layer, with kernel density estimation overlay. OPEN → · see code → |
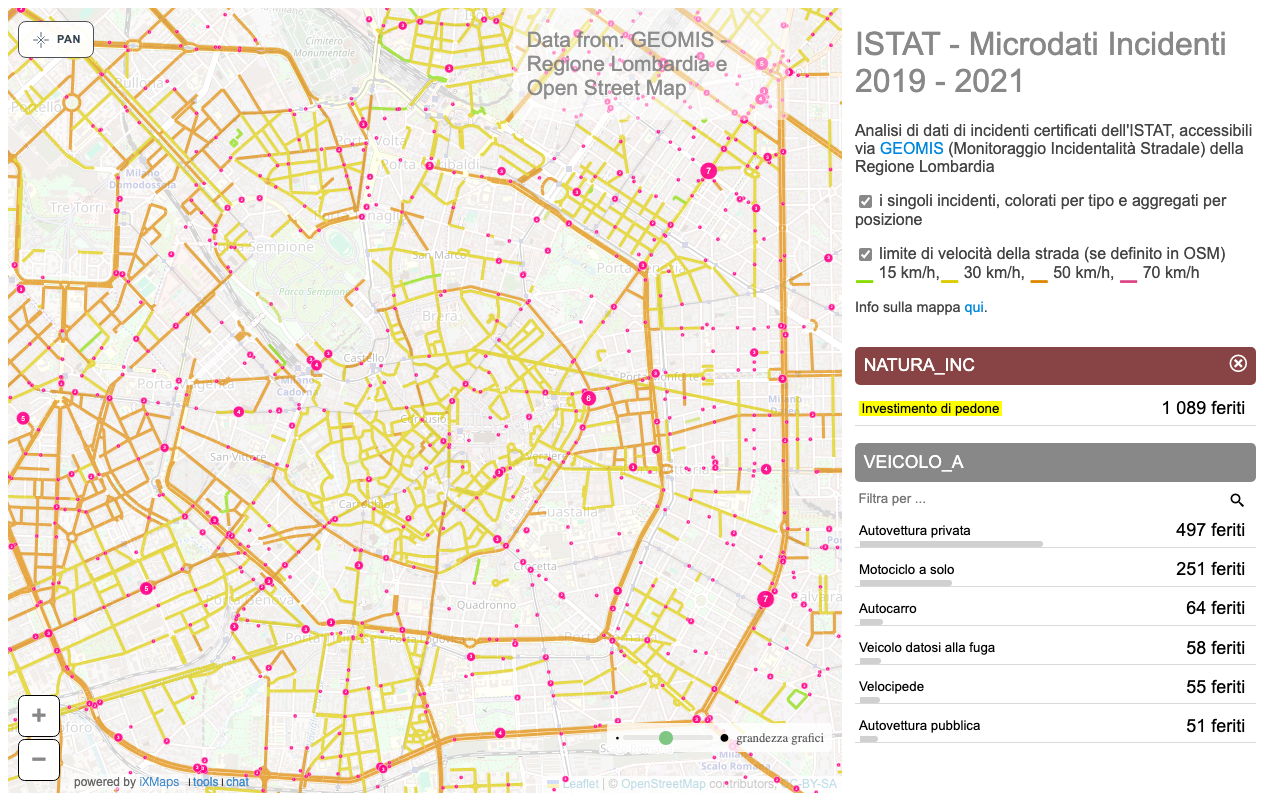 Milano pedestrian accidents (Zone 30) Pedestrian accidents near Zone 30 areas in Milano, by year. OPEN → · see code → |
 ISTAT incidenti minimal Minimal point map of ISTAT accident records. OPEN → · see code → |
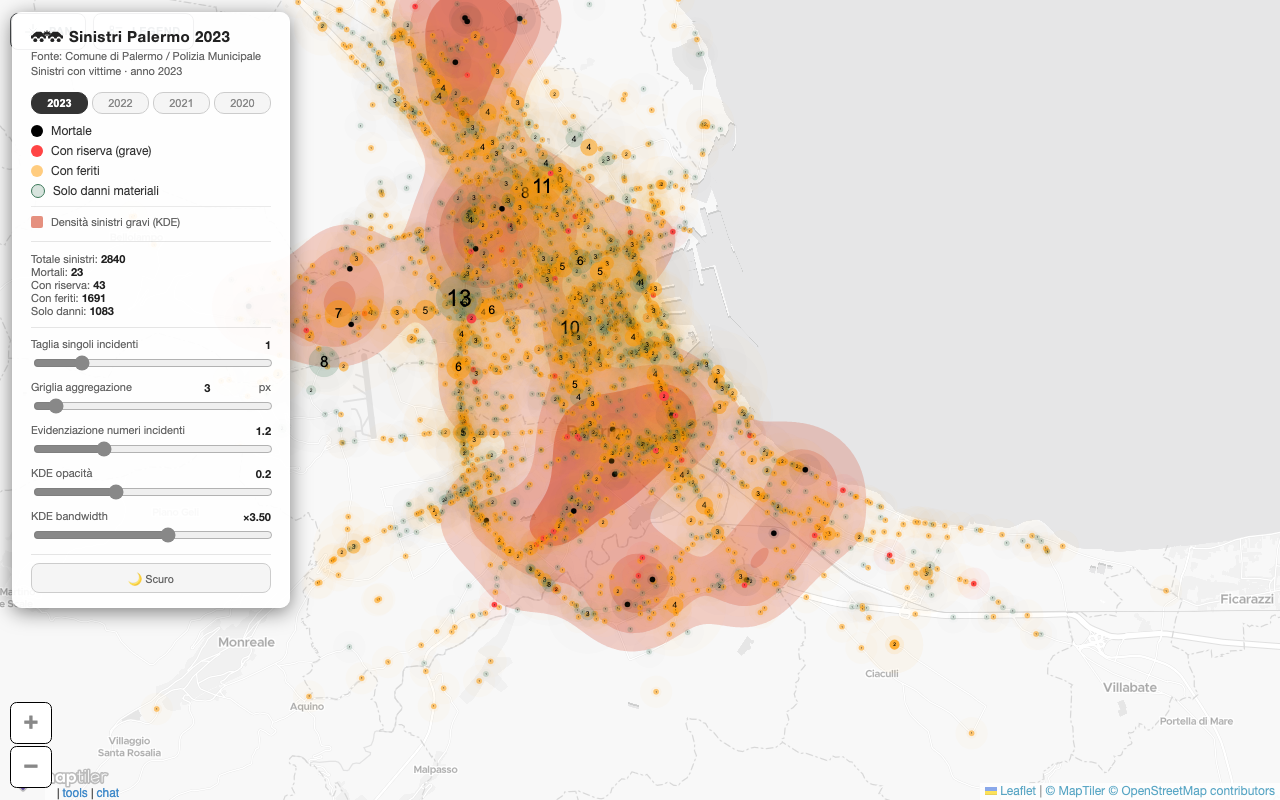 Palermo accidents 2020–2023 Palermo accidents 2020–2023 with position, casualties and danger density analysis. OPEN → · see code → |
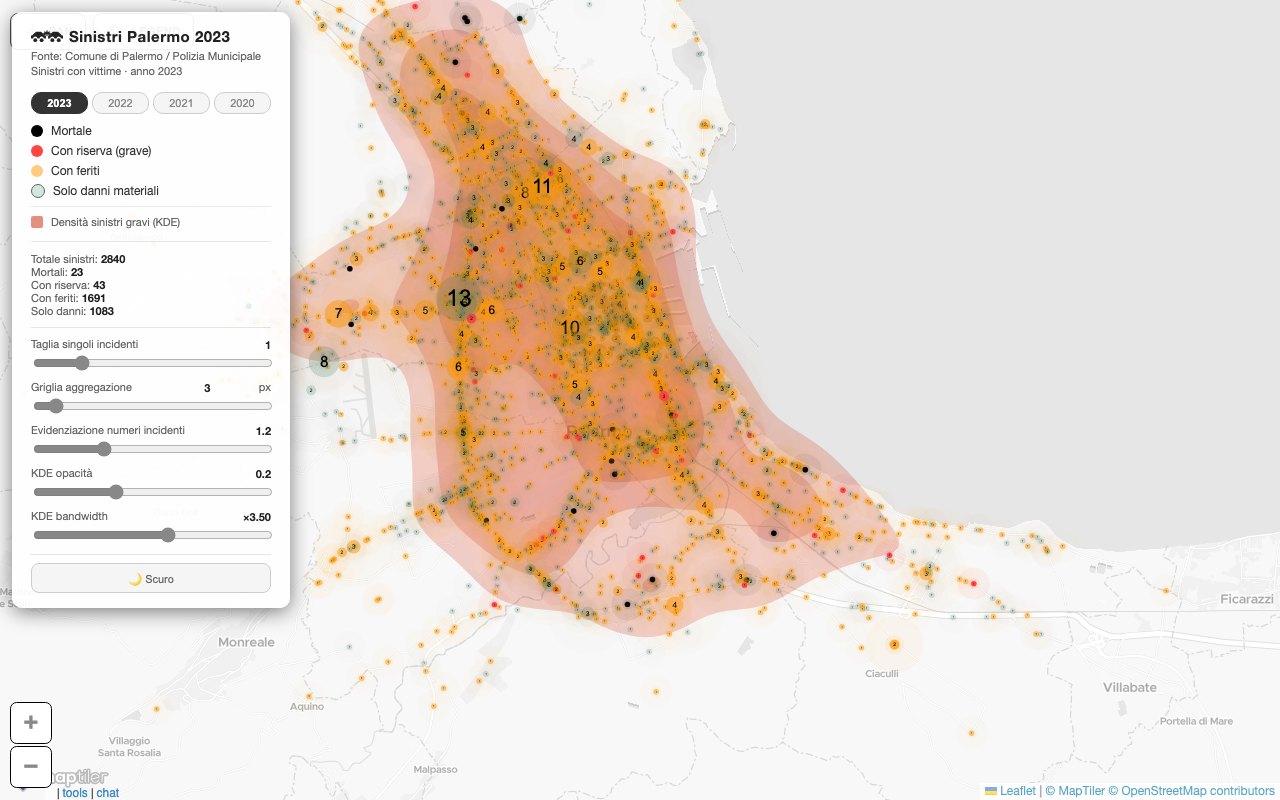 Palermo accidents 2020–2023 II Uses a wider density analysis which includes more accidents (time intensive). OPEN → · see code → |
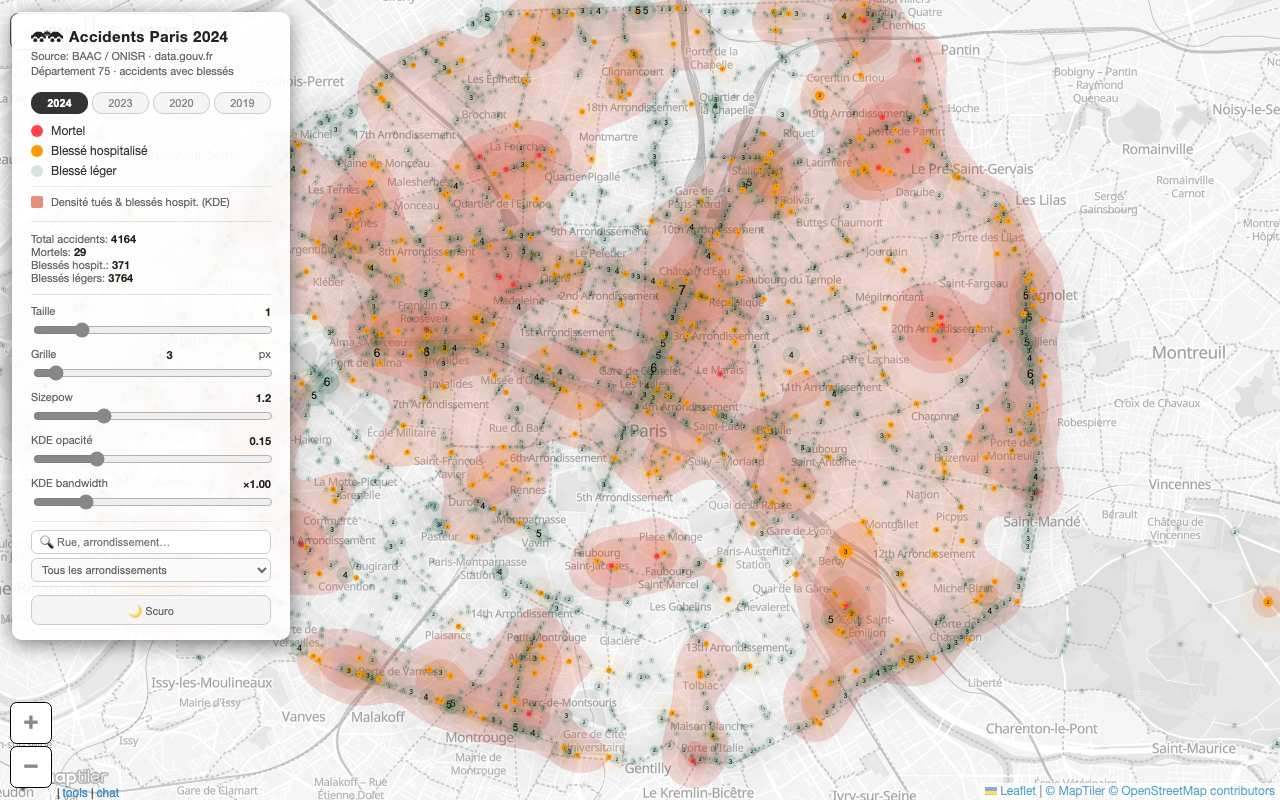 Paris accidents 2024 grid Paris road accidents 2024 aggregated on a regular density grid. OPEN → · see code → |
live/
Maps using live or near-real-time data feeds.
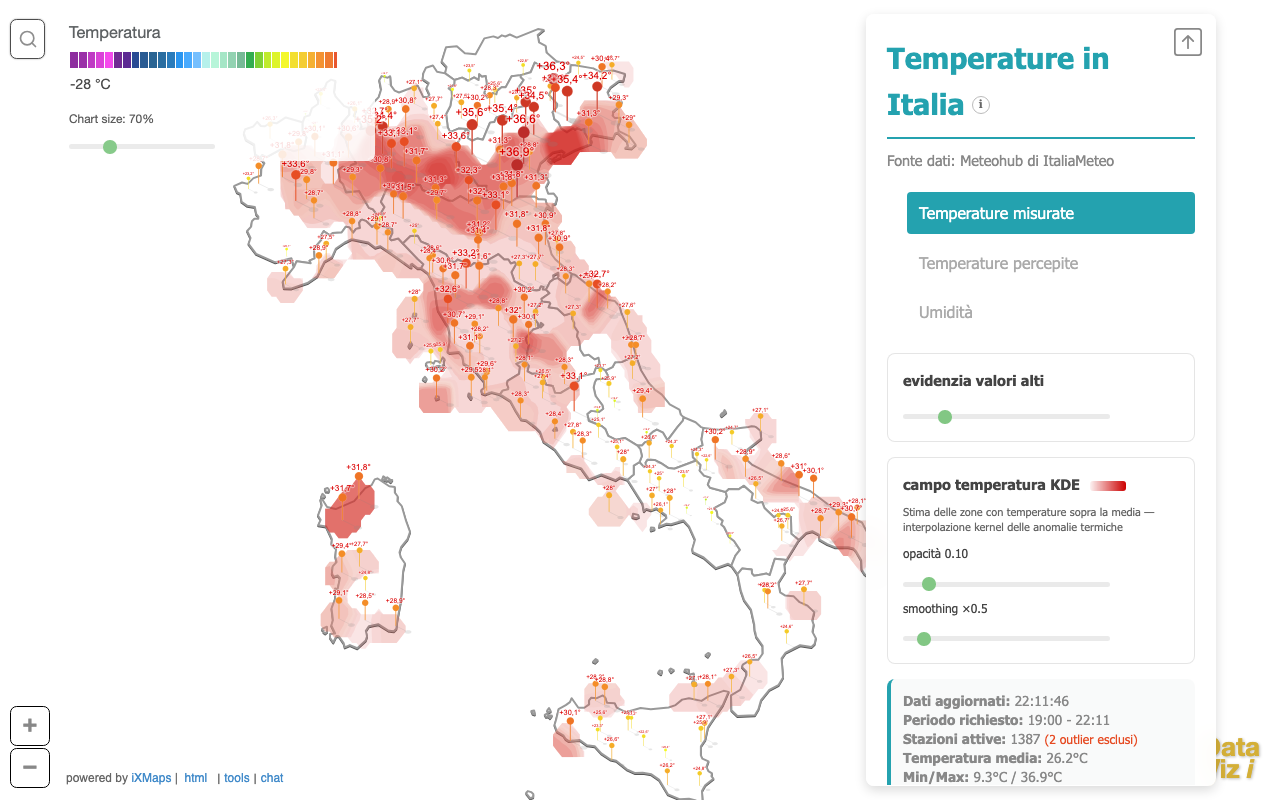 Temperature in Italia (KDE) Current apparent temperature from ItaliaMeteo stations, updated hourly, with a kernel density estimation layer. OPEN → · see code → |
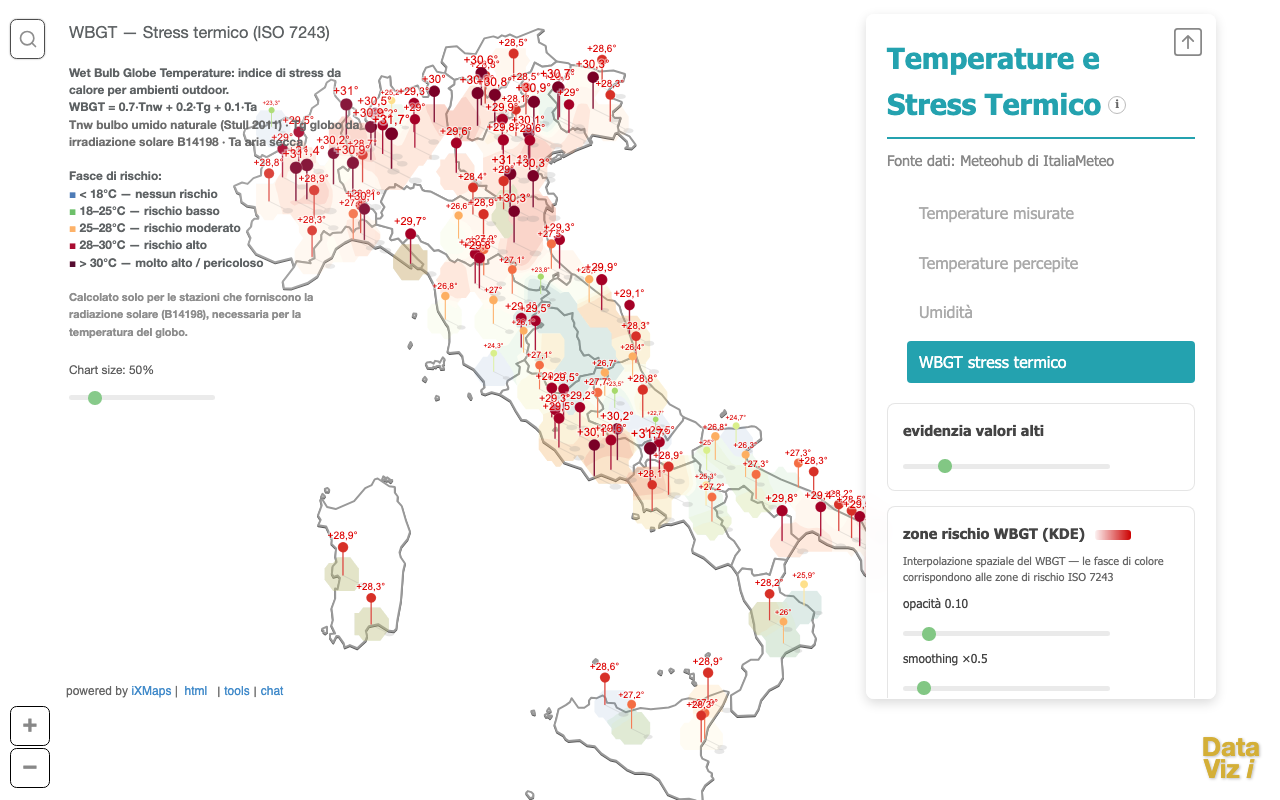 WBGT stress termico (KDE) Outdoor heat-stress index (WBGT, ISO 7243) from ItaliaMeteo stations with solar radiation, with KDE risk-zone overlay. Also includes measured & apparent temperature modes. OPEN → · see code → |
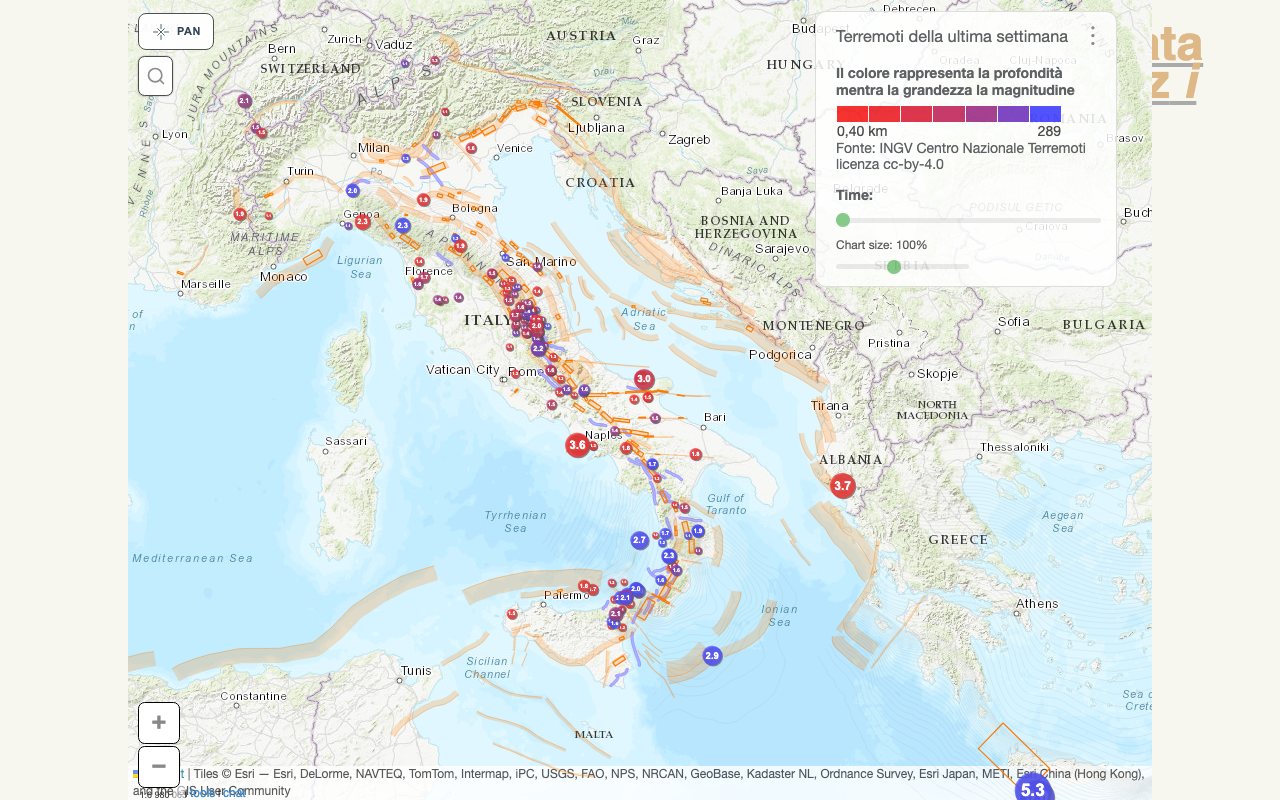 Terremoti ultima settimana Italian earthquakes in the past 7 days, INGV live feed. OPEN → · see code → |
stories/
Narrative map pages.
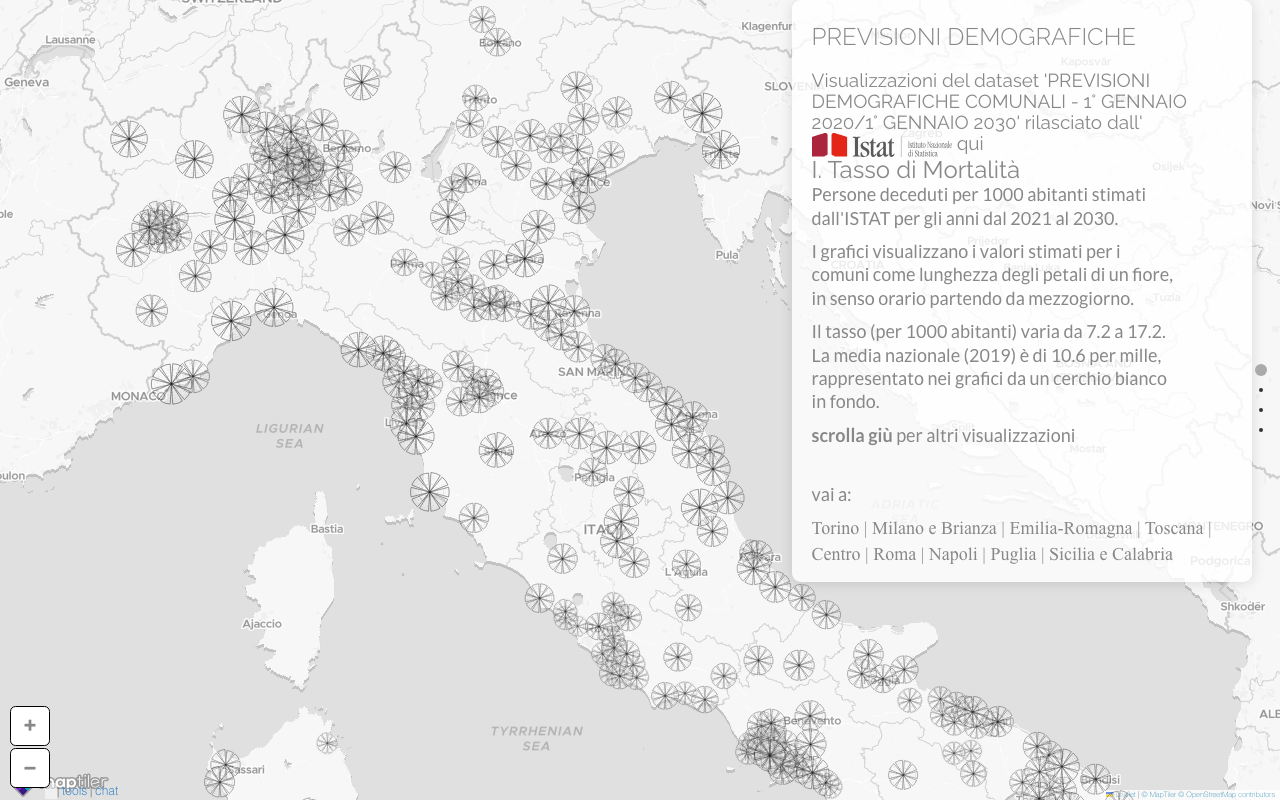 Previsioni demografiche Italian demographic projections 2021–2030 at commune level, ISTAT data. OPEN → · see code → |
video/
Maps embedded alongside video or timeline content.
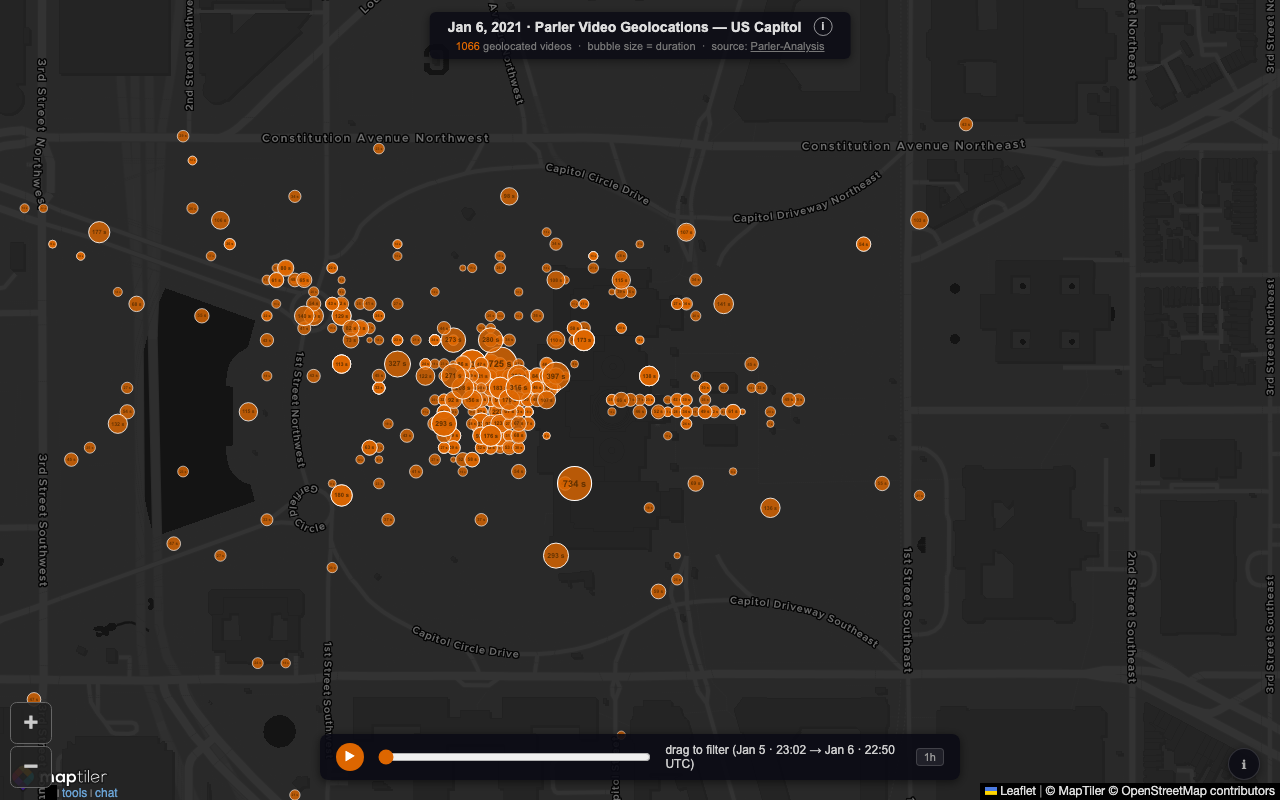 Parler DC riot timeline Parler video posts geolocated near the US Capitol on Jan 6, 2021, with a time scrubber. OPEN → · see code → |
helloworld/
Minimal starter examples for the iXMaps API.
 Hello World (CDN) Minimal map loaded via the ixmaps CDN. OPEN → · see code → |
 Hello World (GitHub.io) Hello World served from GitHub Pages. OPEN → · see code → |
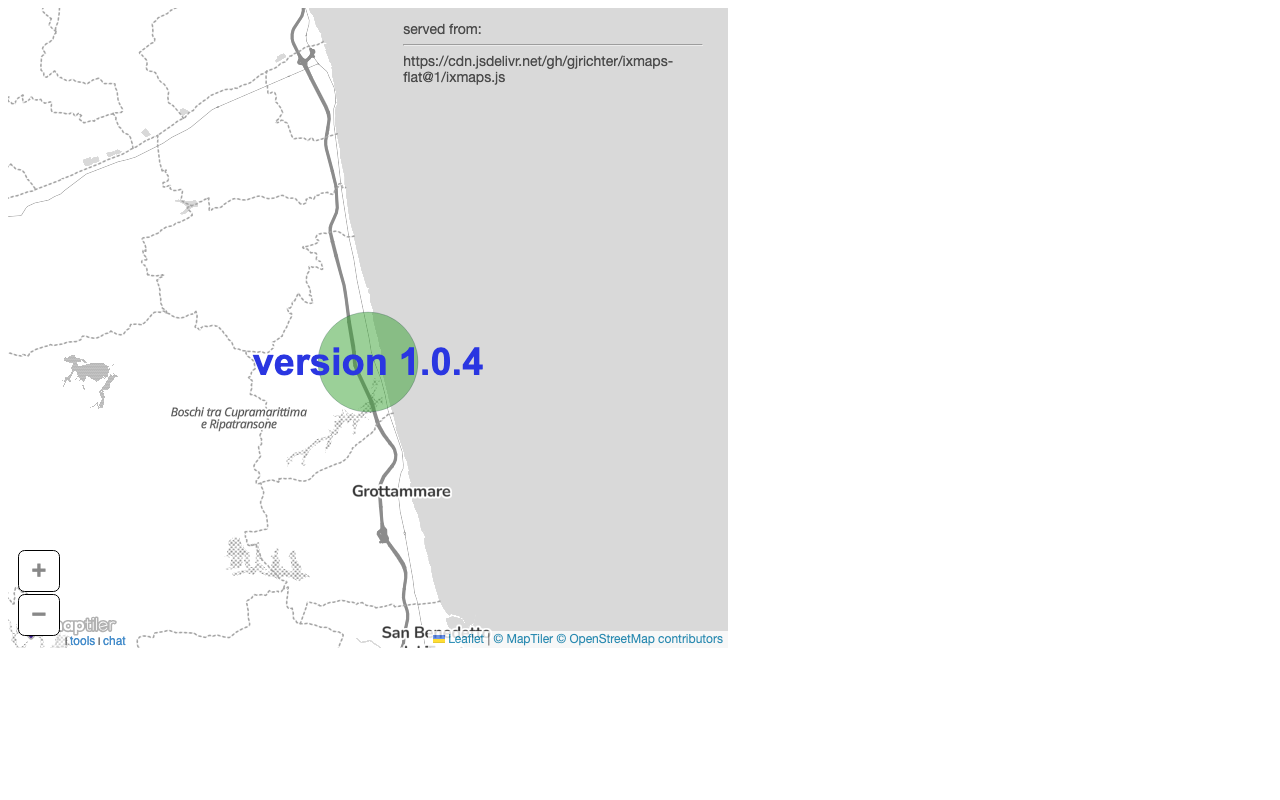 Hello World (jsDelivr) Hello World served via jsDelivr CDN. OPEN → · see code → |
loadproject/
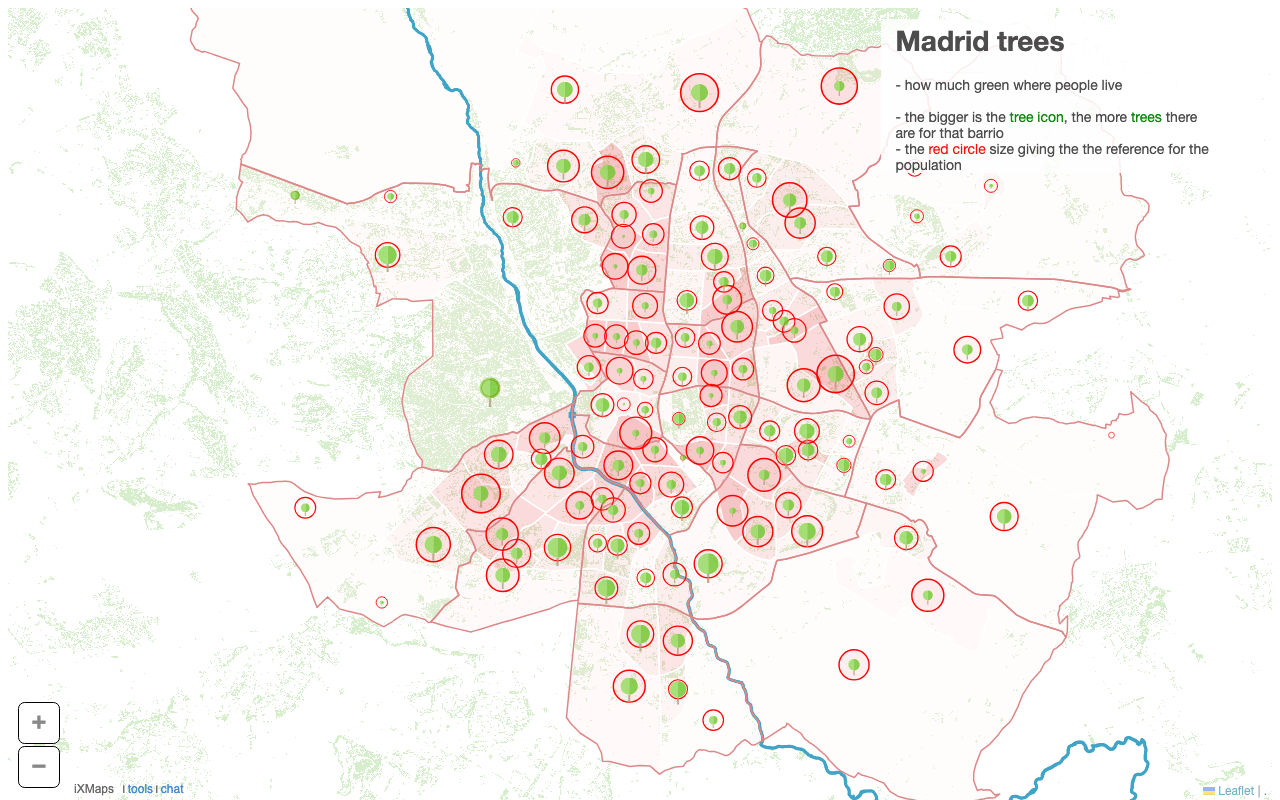 loadProject API — Madrid Load a saved Madrid project via the loadProject API call. OPEN → · see code → |
basics/
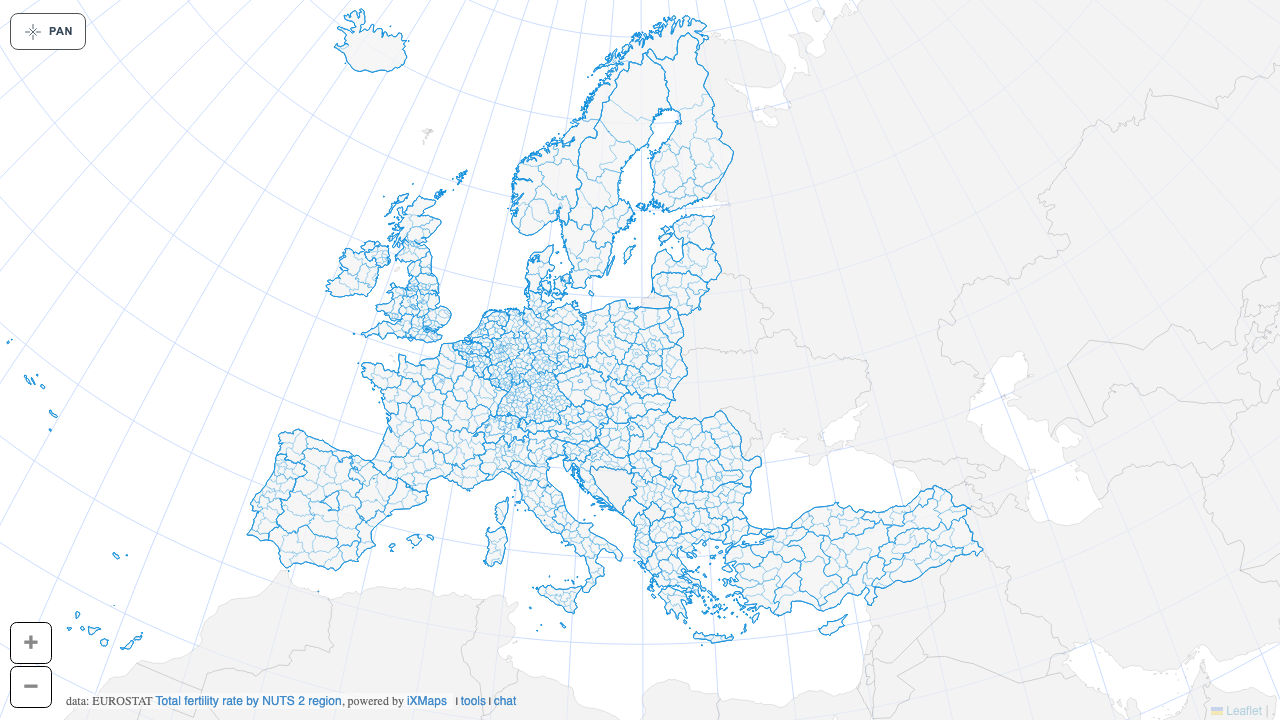 EU NUTS — Lambert projection Fullscreen European NUTS regions map using the Lambert Azimuthal Equal Area projection. OPEN → · see code → |
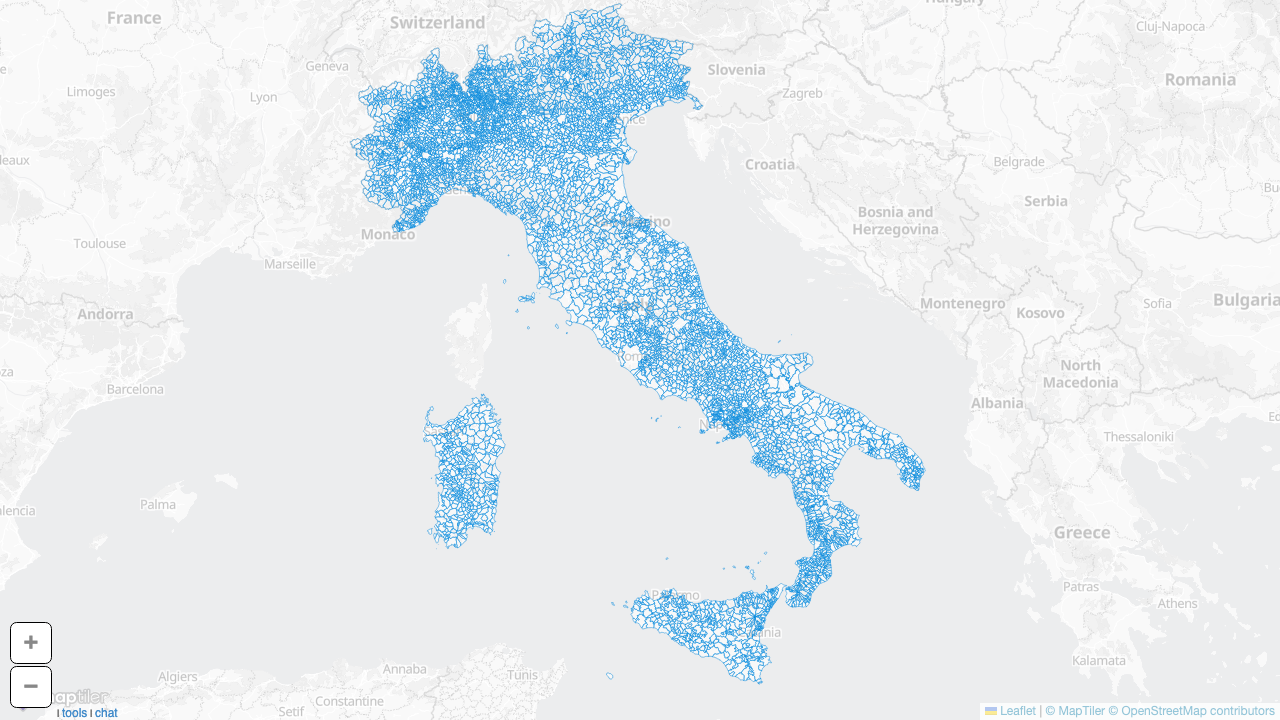 Italy comuni 2025 All Italian municipalities (comuni) as ISTAT boundaries on a vector-tile basemap. OPEN → · see code → |
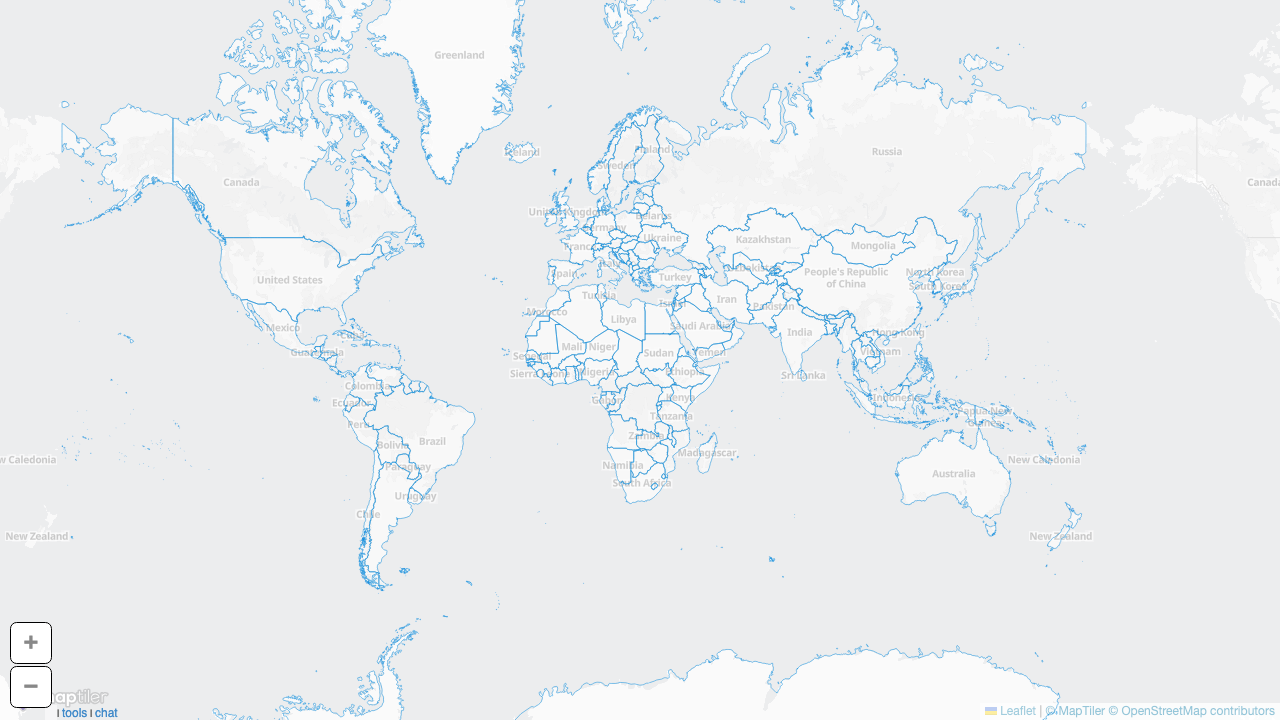 World blueprint Minimal world map template with blueprint-style styling on a vector-tile basemap. OPEN → · see code → |
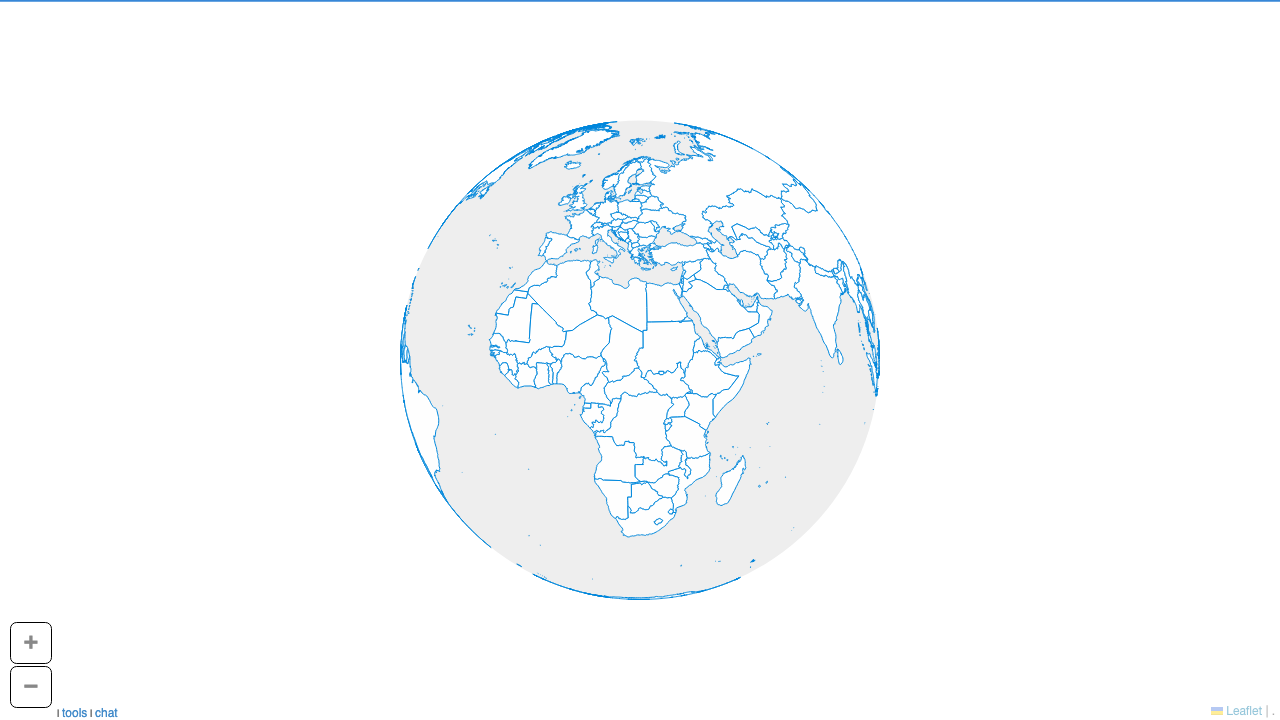 World blueprint — orthographic globe Same blueprint styling on an orthographic globe projection, with the ocean rendered via the native Sphere geometry (no bbox approximation). OPEN → · see code → |